
One cloud, divided into two continents by a dark band. The lamp is hiding behind the band.
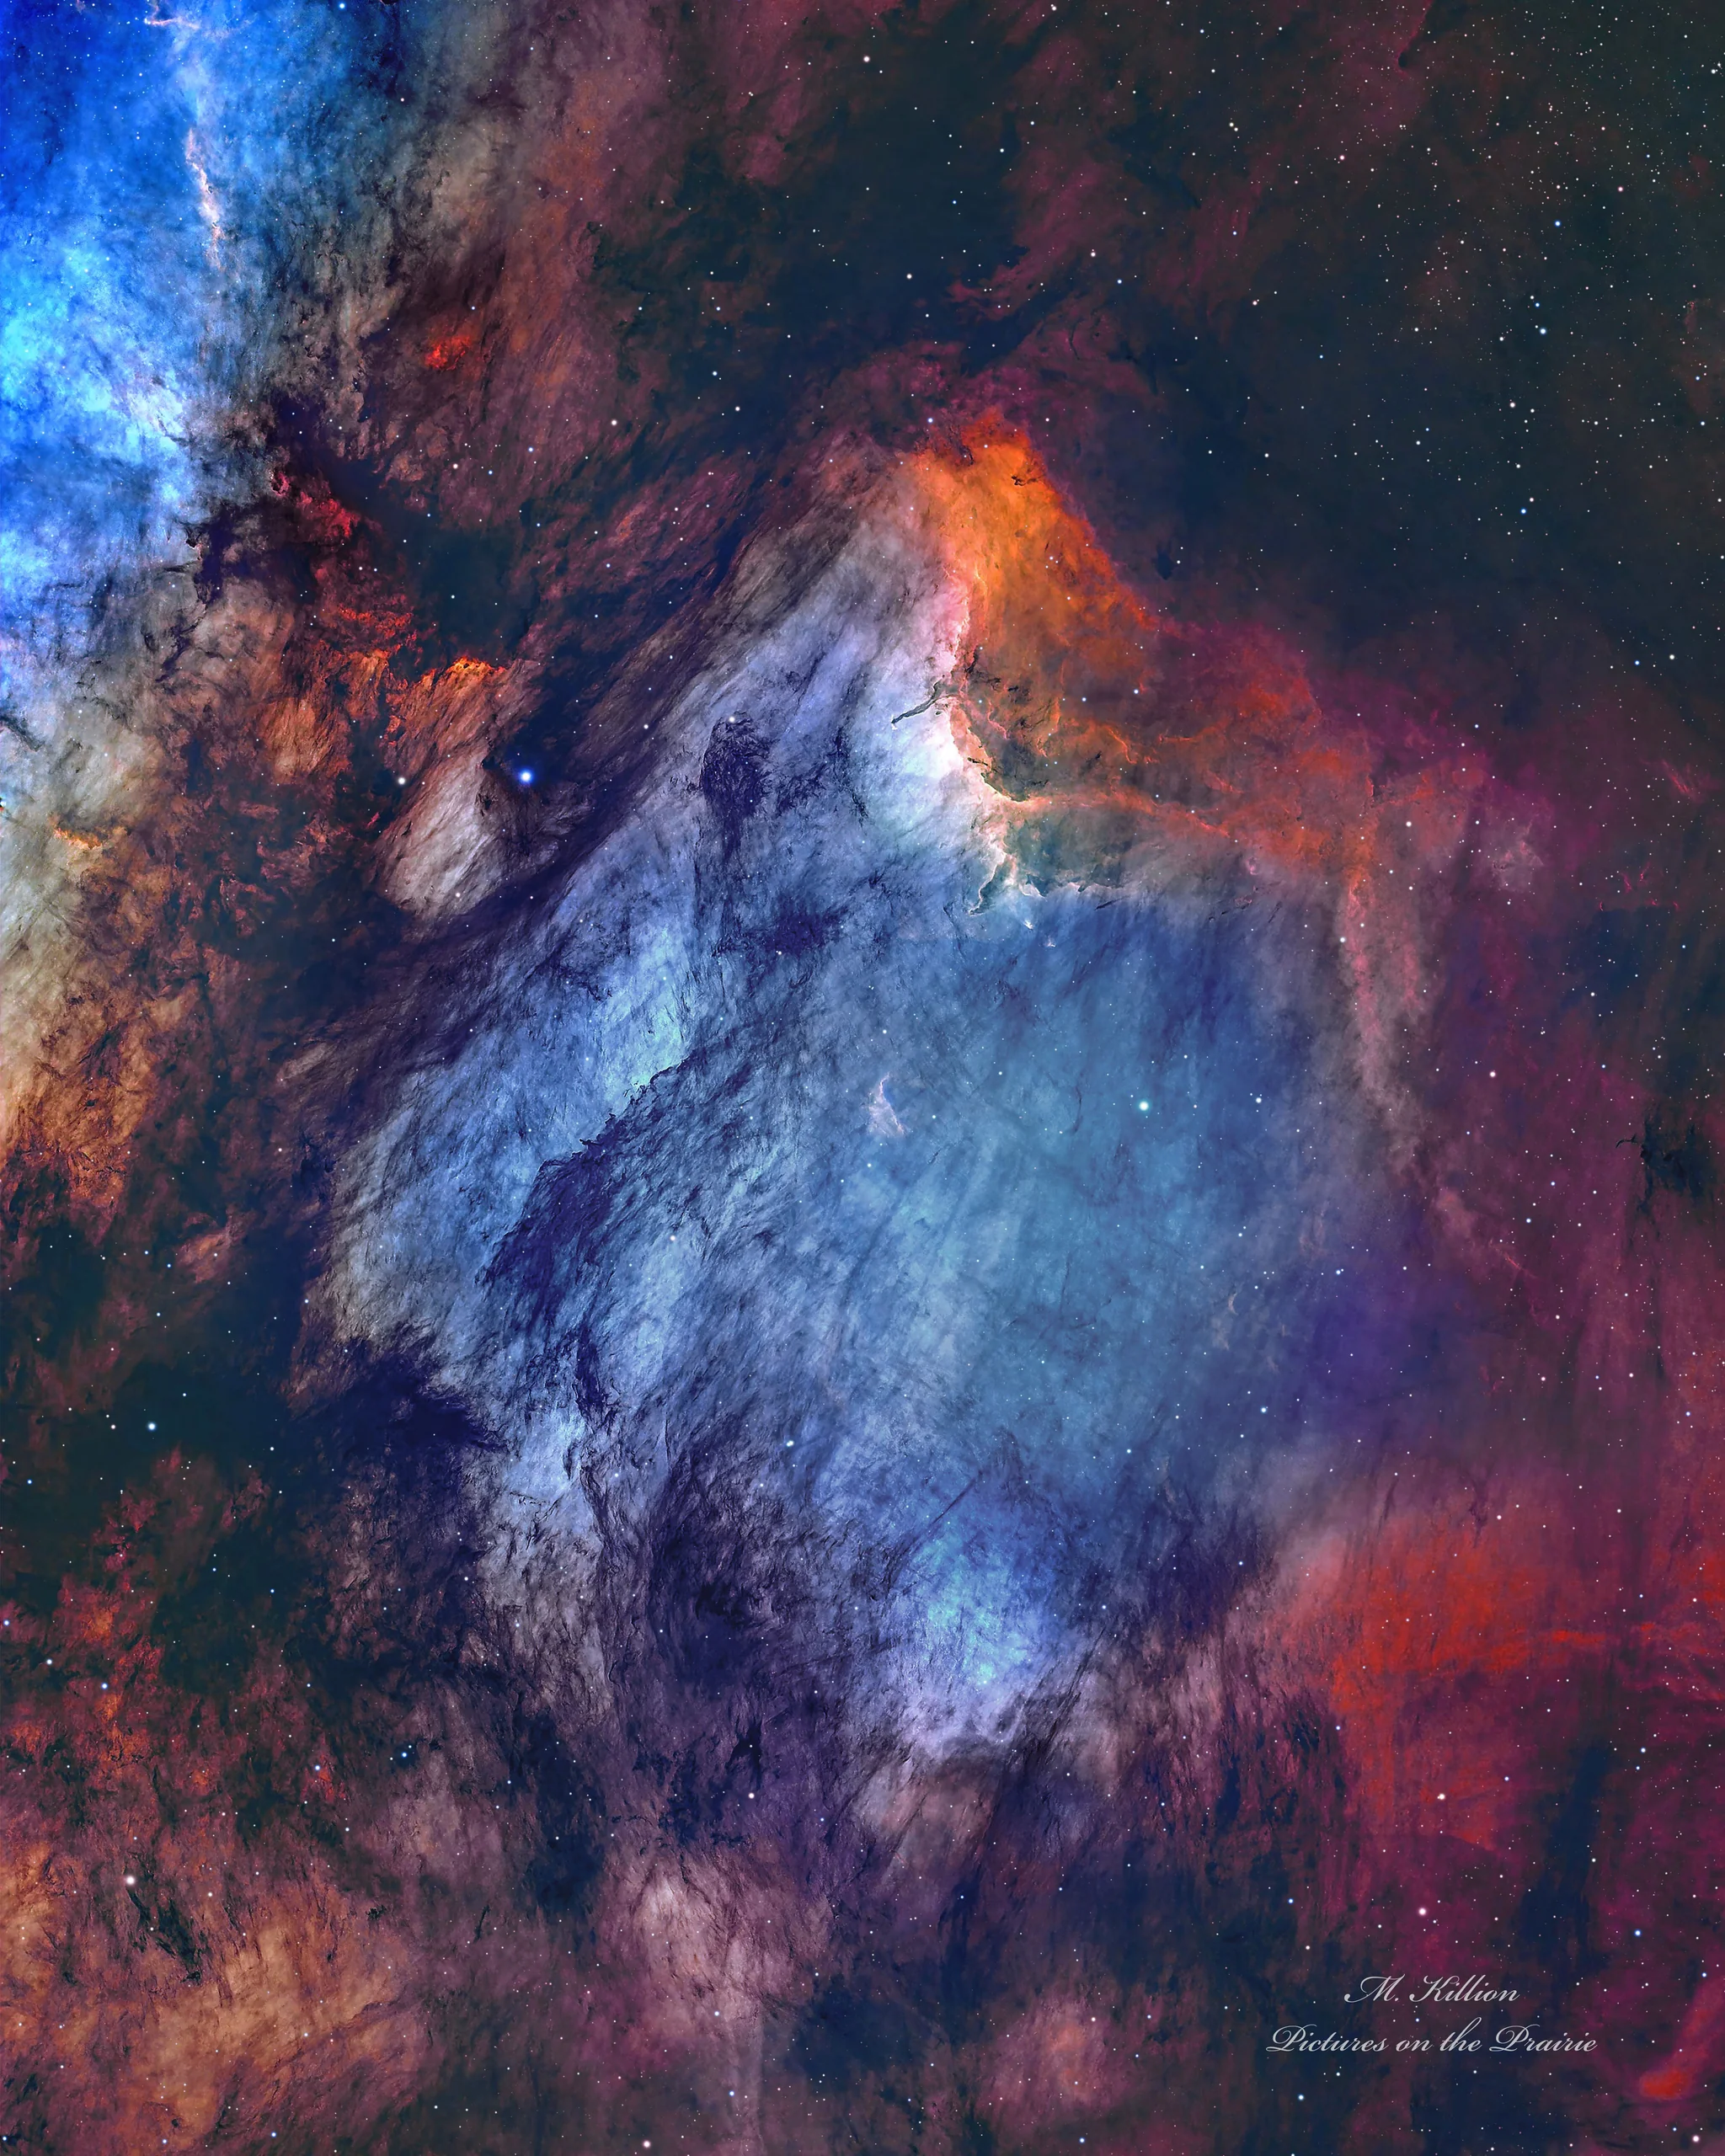
Image: NASA Astronomy Picture of the Day (APOD) | Image credit and copyright: Mark Killion | Today's page
Today's NASA Astronomy Picture of the Day is the result of 25 hours of exposure.
Three phrases in APOD's description are worth holding onto: filaments of dust, the bright orange ionization front at upper right, and the unusually dense, surviving tentacles of cold gas. They are three stages of the same story.
This is the Pelican Nebula, formally IC 5070, in the constellation Cygnus. Beside it lies a more famous neighbor: the North America Nebula, NGC 7000.
That raises the first question.
They Are Not Two Clouds
It is easy to imagine the Pelican and North America nebulae as two separate clouds of gas.
They are not.
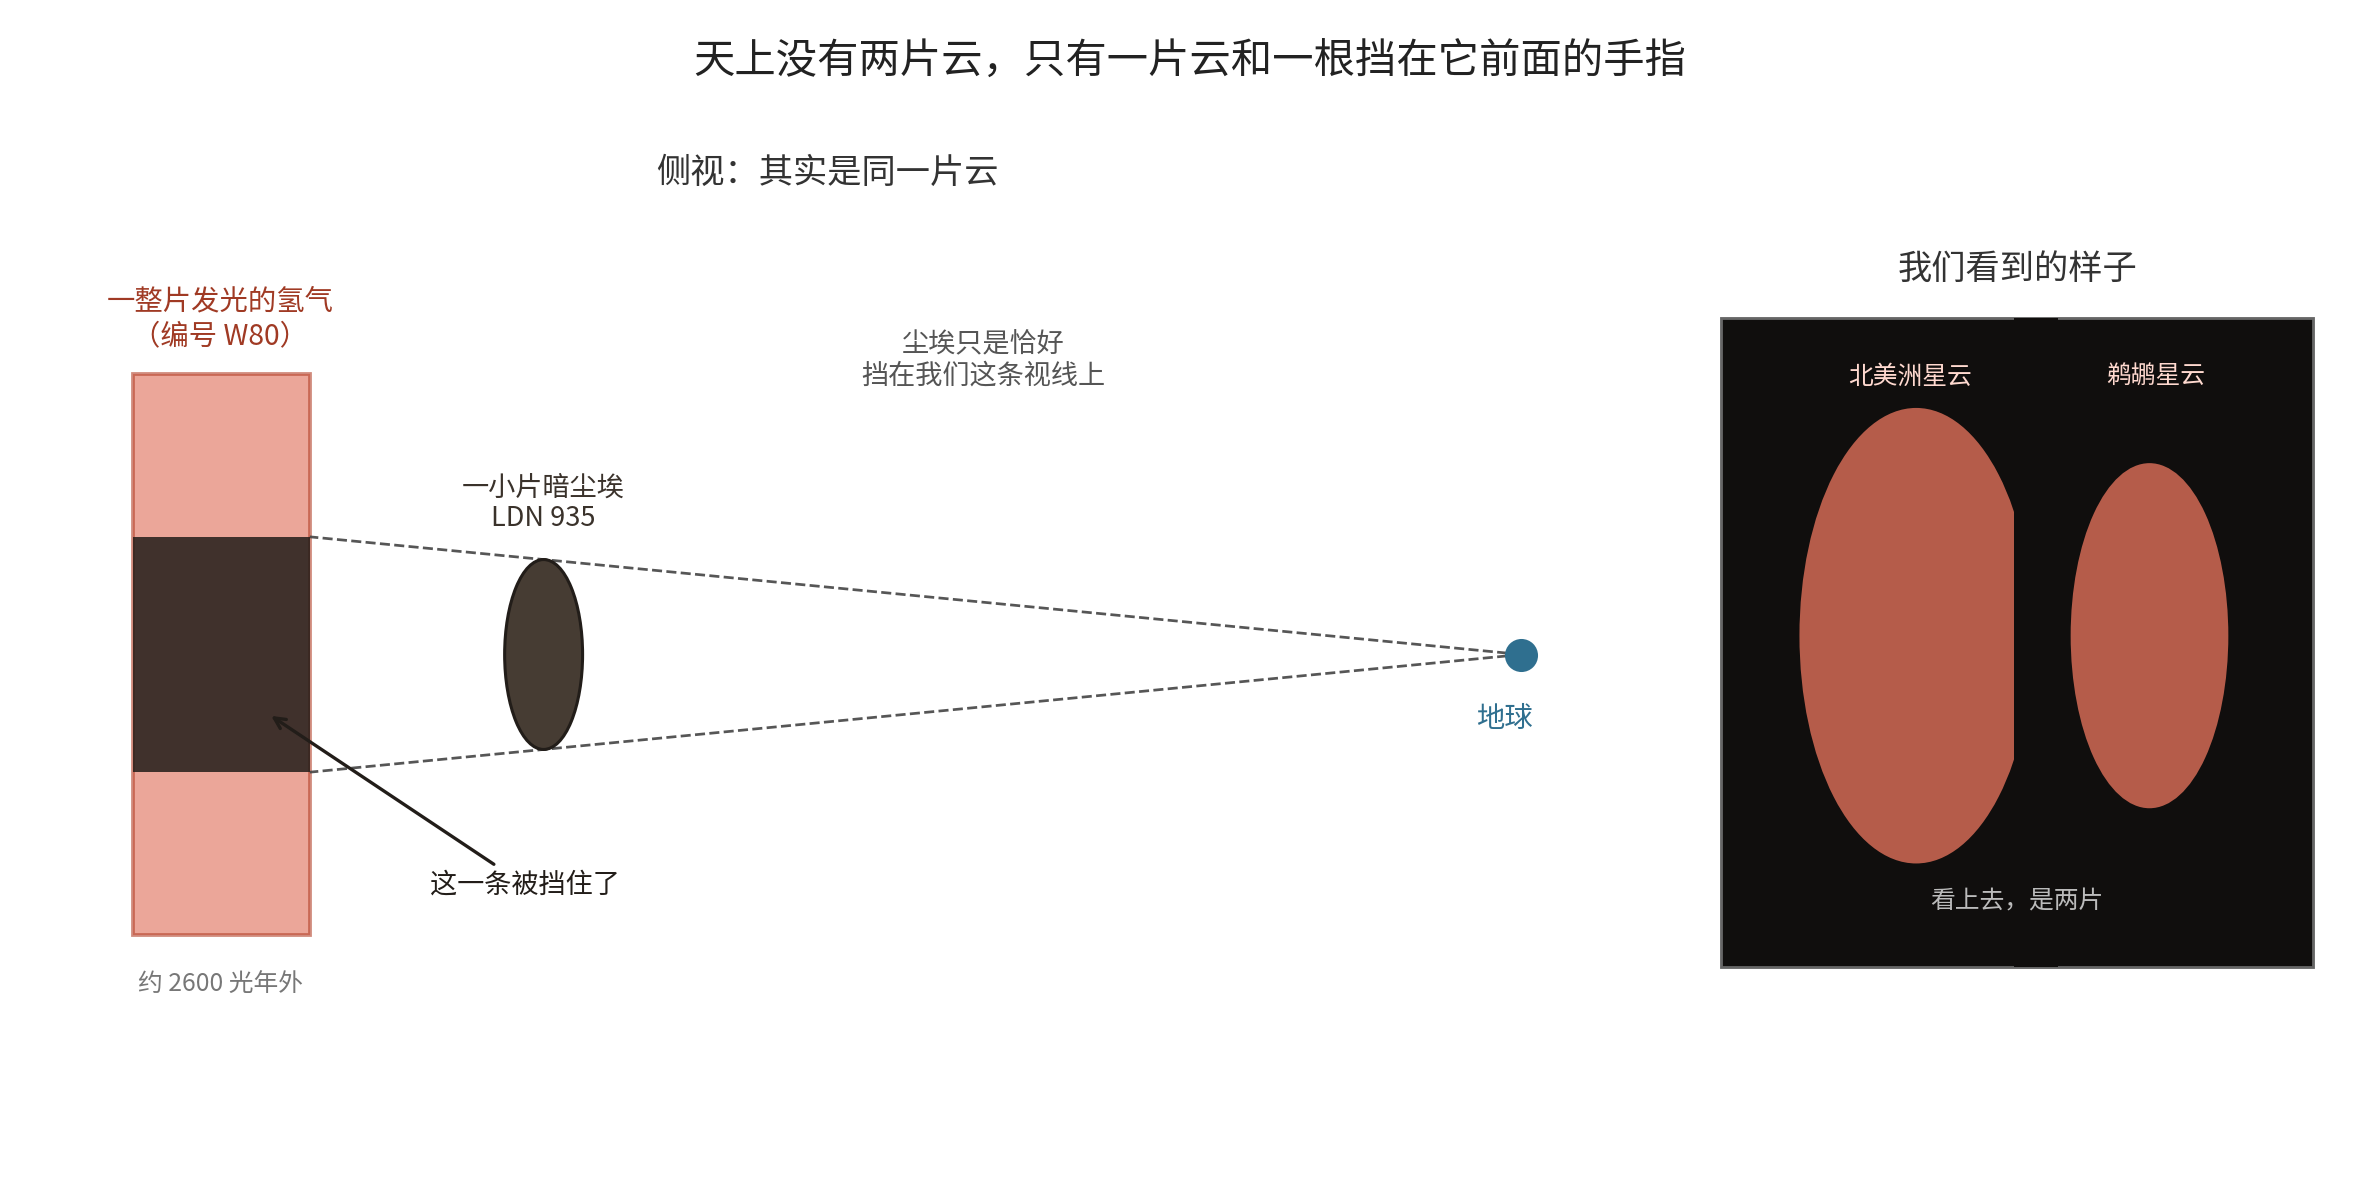
A 2020 paper in The Astrophysical Journal by Kuhn and colleagues, using Gaia data, states the relationship with unusual clarity: the North America and Pelican nebulae form the eastern and western halves of this ionized-hydrogen region, divided in projection on the sky by a dark lane called L933/935.
The phrase "in projection" matters.
Nothing sliced the cloud apart. A band of light-blocking dust simply happens to lie in front of it along our line of sight, hiding the middle of one continuous mass of glowing hydrogen.
A 2017 X-ray survey paper put it even more directly: the two nebulae were cataloged as separate objects because of their apparent shapes, but are now generally understood to be two parts of the same physical cloud of gas and dust. Together they share another designation: W80.
Hold your hand in front of a lamp and let your fingers block part of the light. The lamp has not become two lamps; your fingers have merely divided its glow.
The finger in the sky is LDN 935.
The Lamp You Will Never See
The second question is: what lights this entire expanse of gas?
An emission nebula does not shine by itself. It needs an extremely hot, massive star nearby, one whose ultraviolet radiation strips electrons from hydrogen atoms in a process called ionization. Somewhere behind every nebula like this, there must be a lamp.
The lamp of the North America-Pelican region was not identified until 2005.
It is called the Bajamar Star, cataloged as 2MASS J20555125+4352246. Why did it take so long to find? Because it is invisible in visible light.
The 2020 Gaia paper explains why: it lies behind about 9.6 magnitudes of extinction. What does that mean in brightness? The calculation gives a reduction of roughly 6,900 times.
How did astronomers catch it in 2005? Spanish astronomers Comerón and Pasquali used infrared light, whose longer wavelengths penetrate dust. They first selected 19 candidates from near-infrared photometry, then used near-infrared spectra to eliminate cool, evolved stars one by one. Visible-light spectroscopy finally established a spectral type of O5V. Later work refined the picture: a 2022 study concluded that it is a double-lined spectroscopic binary whose primary is an O3.5 III(f*) star.
Its significance is hard to overstate. The 2020 paper makes an almost categorical claim: within one kiloparsec of the Sun, about 3,260 light-years, no other cluster has recently formed a star as massive as Bajamar A.
The star also has a history. An account from Spain's Center for Astrobiology says it was kicked out: about 1.6 million years ago, it and four other stellar systems were ejected from the cluster where they were born, the Bermuda Cluster. An independent 2020 test using Gaia EDR3 data supported that conclusion: the velocity difference remains.
Its name comes from the geography mapped onto this celestial "North America." Bajamar is the original Spanish name of the Bahamas, from baja mar, or shallow sea, and the star falls near "the Bahamas" beside "Florida" in the North America Nebula. Its birth cluster became Bermuda. Bajamar is not a star name formally approved by the International Astronomical Union; it is an informal name coined by the research team and adopted in the literature.
So the picture is this: the star illuminating an entire North America and a pelican cannot be seen by the human eye. Dust has reduced its brightness about 6,900-fold. It hides in the darkness northwest of the "Gulf of Mexico." And it is a runaway, expelled from home 1.6 million years ago, quietly lighting the whole region ever since.
A Line of Fire Moving Forward
The phrase "ionization front" in APOD's description is the physical heart of the image.
Imagine a molecular cloud at just 10 K, or -263 degrees Celsius, among the coldest environments in the universe. Then the invisible star begins pouring ultraviolet radiation onto it.
Where the radiation strikes, electrons are stripped from hydrogen atoms and the gas temperature surges to about 10,000 K.
How wide is the transition across that three-order-of-magnitude temperature difference? Ohio State University lecture notes give a striking answer: very narrow. At the point where the gas is half ionized, the mean free path of an ionizing photon is only about 0.01 parsec. An ionized nebula around a star should therefore have a very sharp edge.
That edge also advances. The hot, ionized gas inside has far greater pressure than the cold gas outside, so it pushes the neutral material ahead of it.
In one sentence: a black cloud at -263 degrees Celsius is being lit, bit by bit, by ultraviolet radiation from a star you cannot see. On one side of the advancing line is glowing gas at 10,000 K. On the other is still the cold dark.
The bright orange feature at the upper right of the APOD image is that line.
Why are emission nebulae usually red? The color comes from hydrogen's H-alpha line, with a wavelength in air of about 656.28 nanometers, produced when an electron drops from the third energy level to the second. It is hydrogen's easiest visible color to produce because, after a free electron is recaptured by a proton, it descends the energy-level ladder step by step, and about half of those cascades pass through the transition from level 3 to level 2. That "about half" figure comes theoretically from Osterbrock's classic textbook; only an encyclopedia-level citable source was available for this article, a limitation recorded here explicitly.
Why the Tentacles Remain
APOD says that unusually dense tentacles of cold gas have survived.
These elongated pillars appear in other images. The Eagle Nebula's "Pillars of Creation" are the same kind of structure. Why do they remain under a relentless wash of ultraviolet radiation?
NASA gave a concise answer when it revisited the Pillars of Creation in 2015: dense clumps of dust and gas cap the columns. They cast shadows over the gas below, keeping it cool and creating the long, pillar-like structures.
NOIRLab's official caption for this very Pelican Nebula says the same thing: portions of dense, cold molecular cloud survive where dense clumps shield them, forming long, dusty pillars.
Think of wind blowing sand across a desert while someone stands under an umbrella. The exposed sand moves; the patch beneath the umbrella remains and gradually becomes a column. In the nebula, ultraviolet radiation is the wind and a dense knot of dust is the umbrella.
NASA also has an apt description for what happens to the exposed material: winds from massive stars and barrages of charged particles literally sandblast the tops of the pillars away.
A Newborn at the Tip of a Pillar
At the tip of one pillar lies the most dramatic scene in this image.
NOIRLab's official caption notes a faint jet, Herbig-Haro object 555, emerging from the top of a pillar - clear evidence of an unseen protostar there.
Bally and Reipurth discovered it in 2003. Later numerical modeling supplied the detail: this is a bipolar jet emerging from the head of an "elephant trunk" embedded in the nebula. Each jet extends about 25 arcseconds and is roughly 2 arcseconds wide. The southern jet has a measured radial velocity of 80 kilometers per second.
And it is bent.
The paper reports that both jets curve 25 degrees away from the center of the Pelican Nebula, probably deflected by a side wind or by the nebula's own expansion.
Put the scene together: a dust pillar is being burned away inch by inch by ultraviolet light. At its tip, a star that has not yet fully awakened is being born. It sends gas in opposite directions at 80 kilometers per second, and both streams bend under the force of the wider nebula.
A newborn star is already pushing against the cloud that made it.
Twenty-Five Hours and a Square Root
What does a 25-hour exposure actually mean?
It is more precise than saying the photographer waited a long time for a clear image. University of Sheffield lecture notes give the governing relationship: signal-to-noise ratio is proportional to the square root of exposure time. Double the exposure, and the signal-to-noise ratio improves by only about 1.4 times.
Reverse the calculation and the cost becomes stark:
To make an image twice as clean requires four times the exposure. To make it ten times as clean requires 100 times the exposure.
Twenty-five hours is the square-law price of suppressing noise to this degree.
Why not simply take one 25-hour exposure instead of stacking hundreds of shorter ones?
One widespread explanation needs correcting: read noise is not the reason. Read noise does not grow with exposure time, so it favors making each exposure longer. European Southern Observatory material states clearly that when read noise dominates, breaking the same total time into more short frames makes the result worse.
The real reasons are tracking errors, changes in atmospheric seeing, wind, passing aircraft and satellites, sudden clouds, saturated bright stars and, crucially, the ability to discard bad frames. One experienced astrophotographer demonstrated the counterintuitive result: throwing away the worst half of 38 one-minute exposures produced a sharper final image.
Photographer Mark Killion has not published the equipment, filters or exposure breakdown for this image, and no technical page for it was found on his website. His public biography describes a retired structural engineering consultant who began astrophotography in 1992 and returned to it actively after retiring in 2017. There is no evidence for which color mapping this image uses - SHO Hubble palette, HOO or something else - so none is guessed here.
The Nebula Moved House
One small but genuine change: this image's official address is already different from yesterday's.
Every APOD page now carries a notice that NASA's main APOD site is moving from apod.nasa.gov to science.nasa.gov/apod, and the move is visibly underway. A request for apod.nasa.gov/apod/ap260907.html returned 404, while the first APOD page from 1995, ap950616.html, and the August 30 page remained available. The complete APOD archive currently stops at August 31, 2026.
The old pages remain, but new dated pages are no longer being generated at the old address. A notice in NASA's own GitHub repository said the migration would take place during August and September 2026 and asked users to update bookmarks by the end of September.
The site's age is part of the story. On June 16, 1995, two gamma-ray astronomers at NASA's Goddard Space Flight Center, Robert Nemiroff and Jerry Bonnell, put the page online when the World Wide Web was still young. The first image was called Neutron Star Earth and asked what would happen if Earth were compressed to neutron-star density. More than 30 years later, most APOD text is still written by the same two people.
One common claim deserves dismantling: no NASA source was found for the idea that APOD has never been interrupted, and an official counterexample exists. A 1999 announcement said that because agency computers would be shut down around the Y2K transition, APOD would be unavailable from its NASA home and many mirror sites for several days. Mirrors at the Sternberg Astronomical Institute of Moscow State University and the Department of Physics at National Cheng Kung University in Taiwan kept it available.
The more accurate statement is that APOD's image archive has no date gaps since June 16, 1995, but its main site has not always remained online. Around the turn of the millennium, servers in Russia and Taiwan held the page up for the world.
The Woman Who Traced the Shadows
Her name was Beverly T. Lynds. The L in LDN is hers.
In 1962, she took every dark nebula visible on the Palomar Observatory Sky Survey plates and traced it by hand onto tracing paper. She measured each area with a small instrument called a planimeter, then assigned an opacity class from 1 to 6, with 1 the faintest and 6 the darkest. She traced 1,802 nebulae. LDN 935, the dark band in today's APOD, is one of them: 0.914 square degree in area and opacity class 3.
She used both red and blue photographic plates. Her original paper explains the practical reason: having images of the same field in two colors made the detection and classification of dark nebulae more accurate.
Lynds was born in Louisiana on August 19, 1929. She earned a doctorate from the University of California, Berkeley, in 1955 for work on white-dwarf spectra.
Her obituary in Sky & Telescope records what happened next:
She accepted a position at the University of Chicago. Soon afterward, the offer was withdrawn when the university discovered that she was a woman graduate student.
(Beverly is used for both men and women in English. The university learned only when it saw her.)
She later became associate director of Kitt Peak National Observatory. In 1965, using the same method, she compiled the LBN catalog of bright nebulae. After retirement she devoted herself to science education and worked to address inequalities of gender and race.
On October 5, 2024, after suffering a stroke in early September, she died peacefully in hospice care in Portland, Oregon. She was 95.
Sources: NASA Astronomy Picture of the Day for September 7, 2026, and the apod.nasa.gov archive; NASA Night Sky Network material on the Summer Triangle and the Great Rift; NASA, Hubble Goes High-Definition to Revisit Iconic Pillars of Creation; the official NOIRLab caption for the Bally and Reipurth / Mayall 4-meter image; Kuhn et al., The Astrophysical Journal (2020, Gaia DR2); Kuhn and Hillenbrand, Research Notes of the AAS (2020); Maíz Apellániz et al., Astronomy & Astrophysics (2022); Damiani et al., Astronomy & Astrophysics (2017); Comerón and Pasquali, Astronomy & Astrophysics 430, 541 (2005); Bally and Reipurth, The Astronomical Journal 126, 893 (2003); Kajdič and Raga (2007); Lynds, The Astrophysical Journal Supplement Series 7, 1 (1962); Froebrich et al., Monthly Notices of the Royal Astronomical Society 506, 5989 (2021), and the HOYS project website; Spain's Center for Astrobiology; astrophysics lecture notes from Ohio State University and the University of Sheffield; European Southern Observatory material on signal-to-noise ratio; OpenStax Astronomy; the National Institute of Standards and Technology Atomic Spectra Database; Sky & Telescope reports on observing the North America Nebula and its obituary of Beverly Turner Lynds; and NASA GitHub apod-api issue 172.