
From orbit, Tropical Cyclone Xavier looks like a white spiral tightening over blue water. NASA Earth Observatory published this image on November 20, 2026, as the Southwest Pacific storm season began with a burst of rapid intensification.
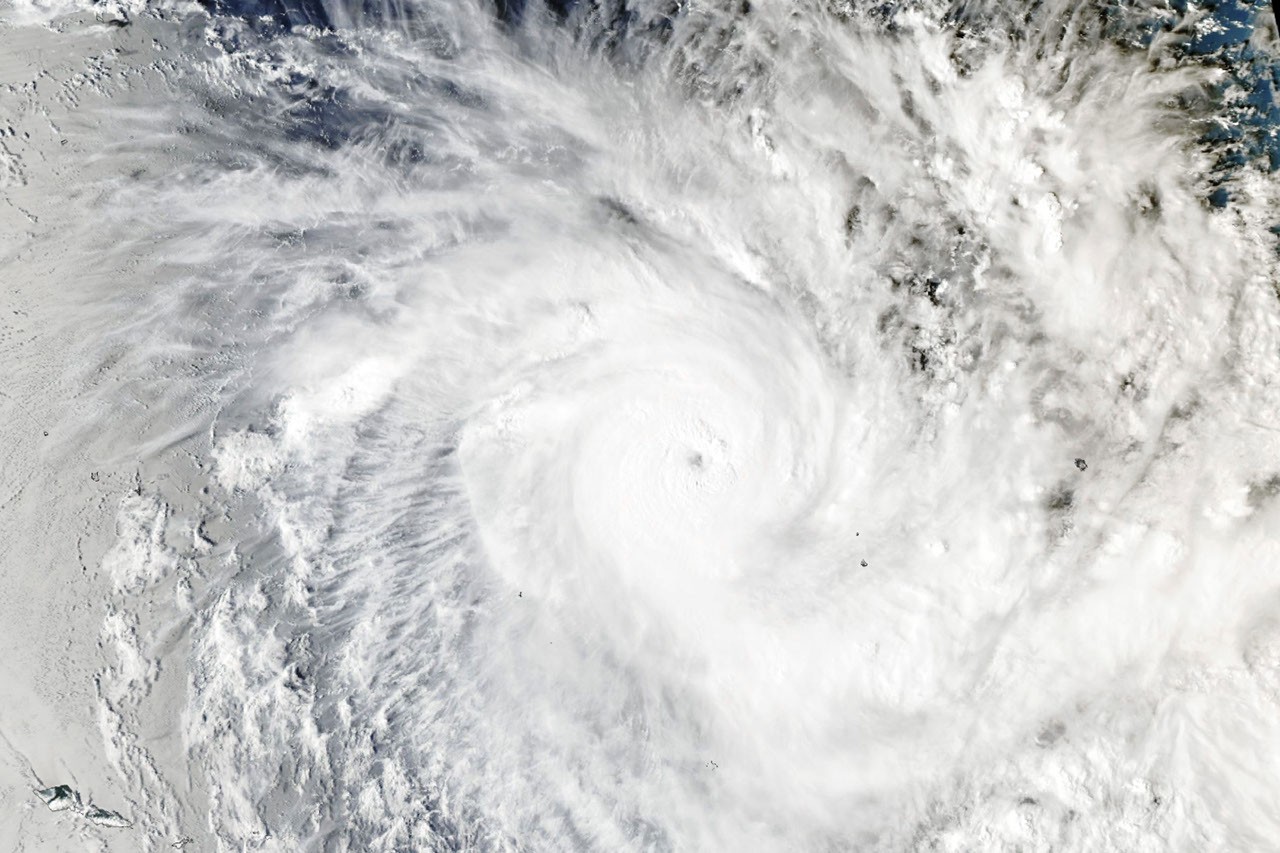
Image: NASA Earth Observatory image by Lauren Dauphin, using MODIS data from NASA EOSDIS LANCE and GIBS/Worldview. Original page
NASA's Aqua satellite captured this view with MODIS at 02:53 UTC on November 17. Forecasters estimated winds near 195 kilometers per hour; later that day, winds reached about 220 kilometers per hour. That was Category 5 on the regional cyclone scale and Category 4 on the Saffir-Simpson scale.
Warm water as fuel, wind shear as scissors
Tropical cyclones draw energy from warm ocean water. Xavier moved over seas near 29°C, warm enough to keep evaporation supplying moist air. As that air rose, cooled, and condensed, it released heat that helped the low-pressure system organize. Winds changed little with height, so low wind shear did not tear the rotating cloud column apart.
NASA places the storm along the southwestern edge of a broad tongue of warm water stretching from the coast of South America toward the central Pacific. That pattern is associated with El Nino, which has influenced the region since June. El Nino does not create a particular storm, but it can alter ocean temperatures and circulation, making eastern formation and rapid strengthening more likely in this basin.
Xavier later met drier air and less favorable wind shear, then weakened while moving west. Satellite images are beautiful, but the storm also brought damaged homes and power disruptions to islands in its path. The same observations that make a striking picture can support weather warnings.
Next time you view a satellite image, find the most tightly curved cloud bands and compare them with the surrounding sea surface. One image shows where a storm is; repeated observations show whether it is strengthening or weakening. The Southwest Pacific season usually peaks around February. Follow Fiji Meteorological and Hydrological Service warnings for current conditions.
Read NASA's Xavier analysis and the Fiji service's tropical cyclone warnings.